Financial Dashboard: understand your studio's financial health over time
What it is
Section titled “What it is”The Financial Dashboard is the system’s most in-depth financial analysis dashboard. The Financial Hub is where you record a payment or receipt right away, and the Financial tab in the Dashboard gives you a quick snapshot of what’s due this week, without interrupting your daily routine. This dashboard is different: it helps you understand your studio’s financial health over time — compare periods, see where expenses come from, and spot days when cash is at risk before they happen.
When to use it
Section titled “When to use it”- At the end of the month, to compare results with the previous month (or year).
- Before making a major purchase of healing ointment or another supply, to check whether your projected cash balance can cover it.
- To find out whether expenses are concentrated in a few categories or cost centers.
Before you start
Section titled “Before you start”The Financial Dashboard is part of the Finance module — the same module that gives you access to the Financial Hub, Chart of Accounts, and Expenses. If you don’t see Dashboards in the menu, or Financial Dashboard inside it, ask the studio owner to enable the Finance module for your business type and grant you access under Access → Profiles.
Step by step
Section titled “Step by step”Step 1 — Review key metrics and account balances
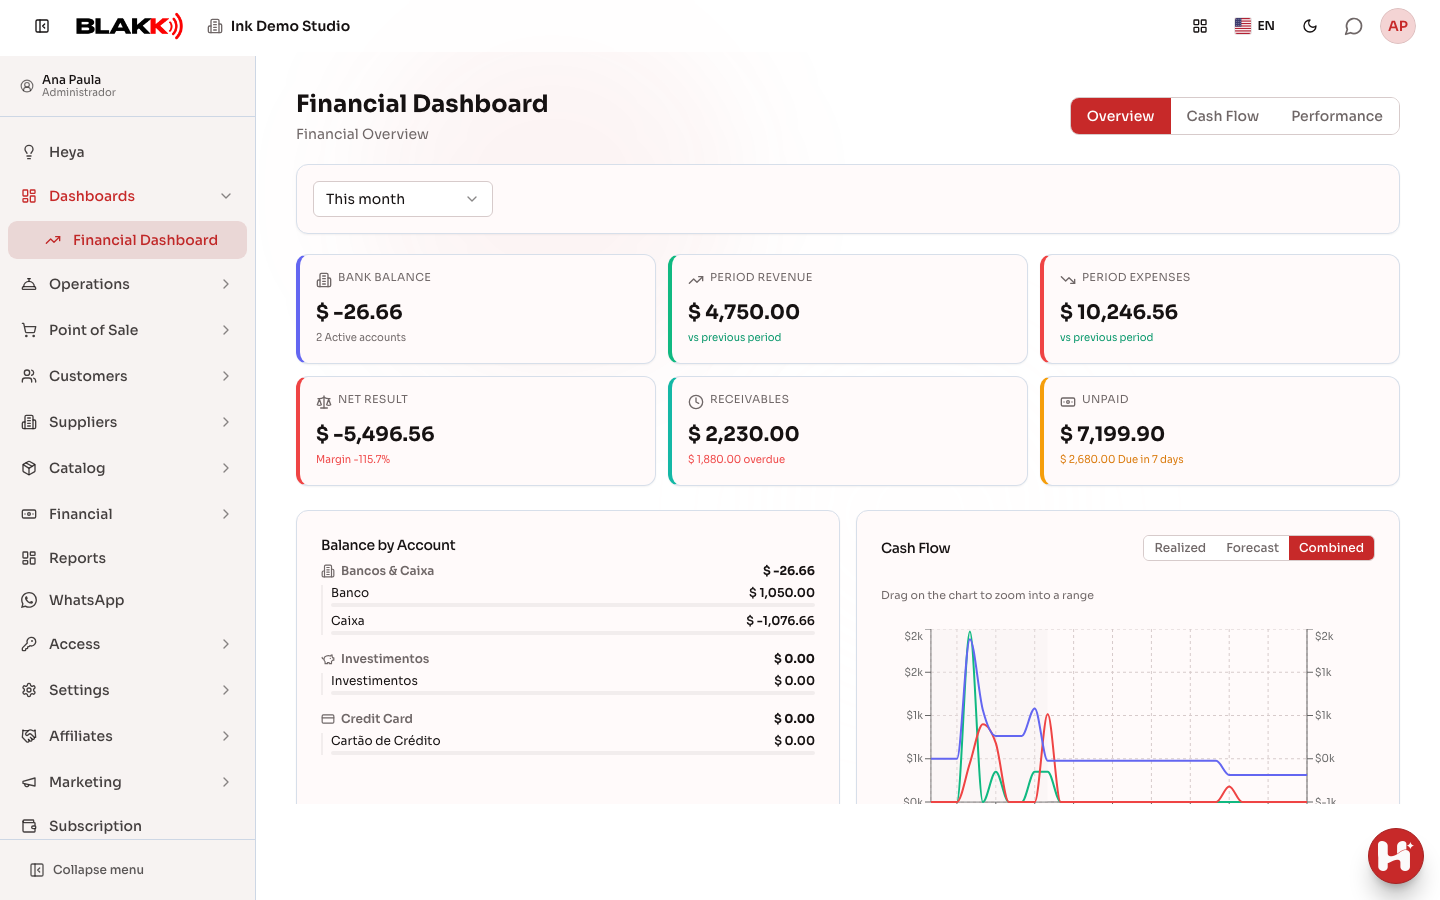
Section titled “Step 1 — Review key metrics and account balances”When you open the Financial Dashboard, the Overview tab is selected by default, with the period set to this month. At the top, you’ll see bank balances, revenue and expenses for the period (with the change from the previous period), net income, and how much is still to be received and paid. Below that, Balance by Account shows the balance of each bank account, investment account, and credit card.
Step 2 — Review actual and forecast cash flow
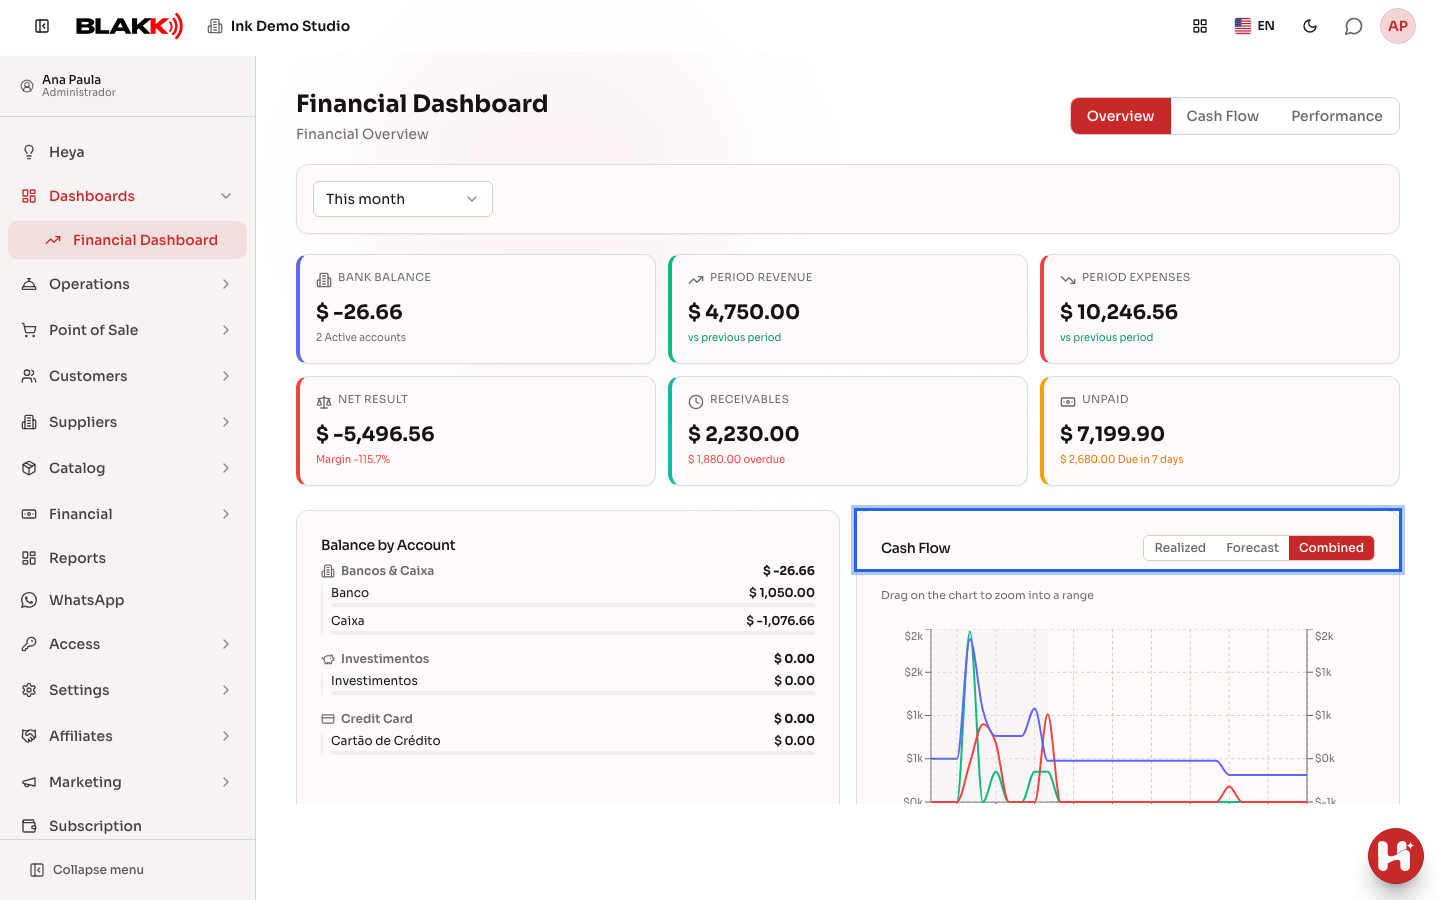
Section titled “Step 2 — Review actual and forecast cash flow”Still on the Overview tab, the Cash Flow chart shows incoming funds, outgoing funds, and the running balance. Switch between Realized (what has already happened), Forecast (what’s scheduled), and Combined (both together) to choose what to view.
Step 3 — Check what’s due to be received and paid
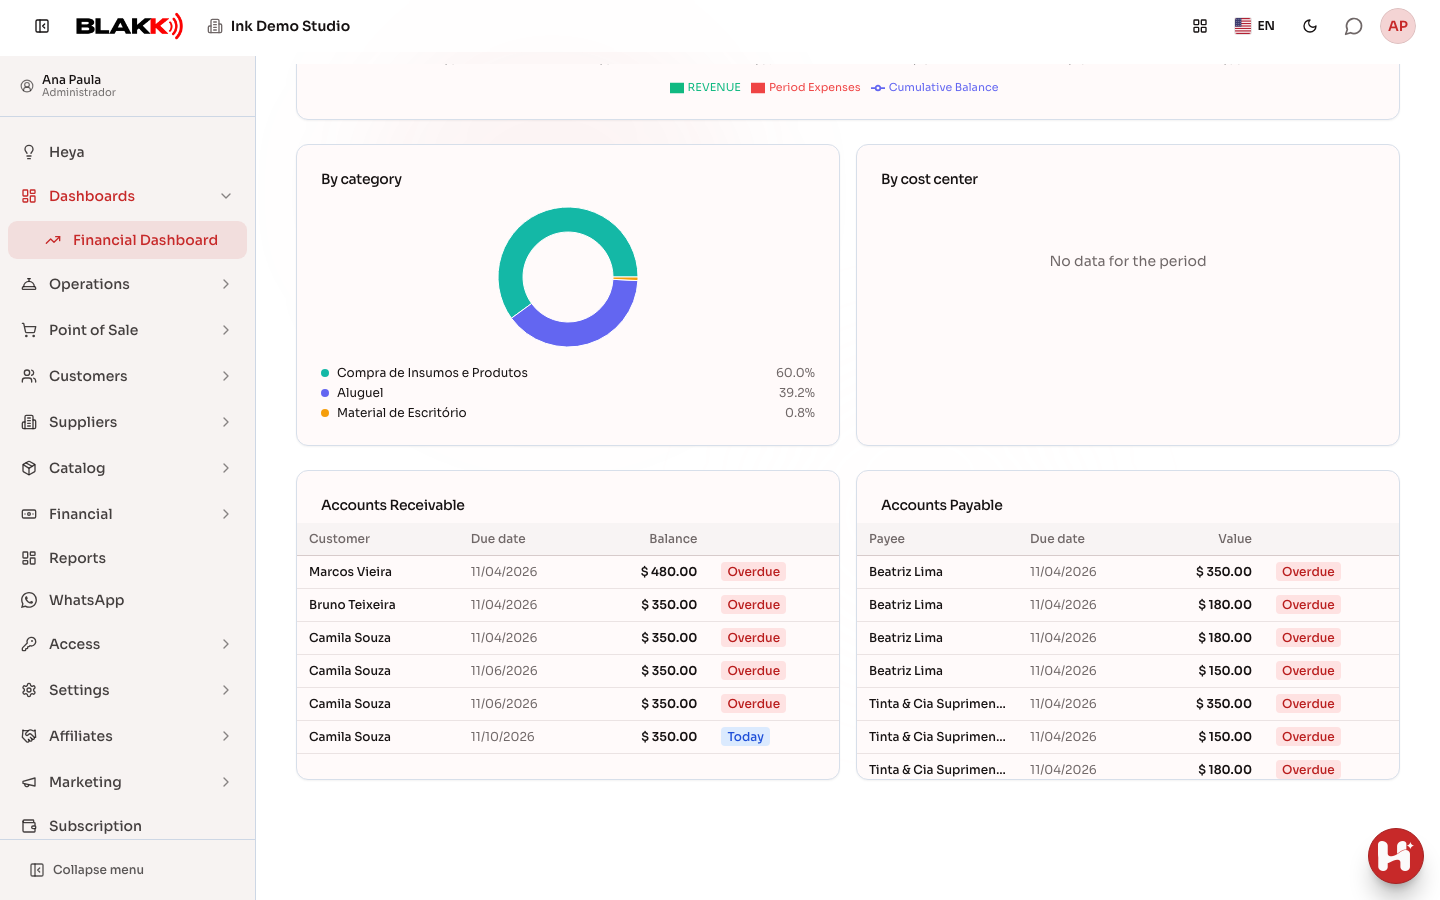
Section titled “Step 3 — Check what’s due to be received and paid”Scroll to the bottom of the Overview tab to see the period’s Accounts Receivable and Accounts Payable tables — and the two donut charts just above them, which break down expenses by category and cost center.
Step 4 — Compare periods on the Performance tab
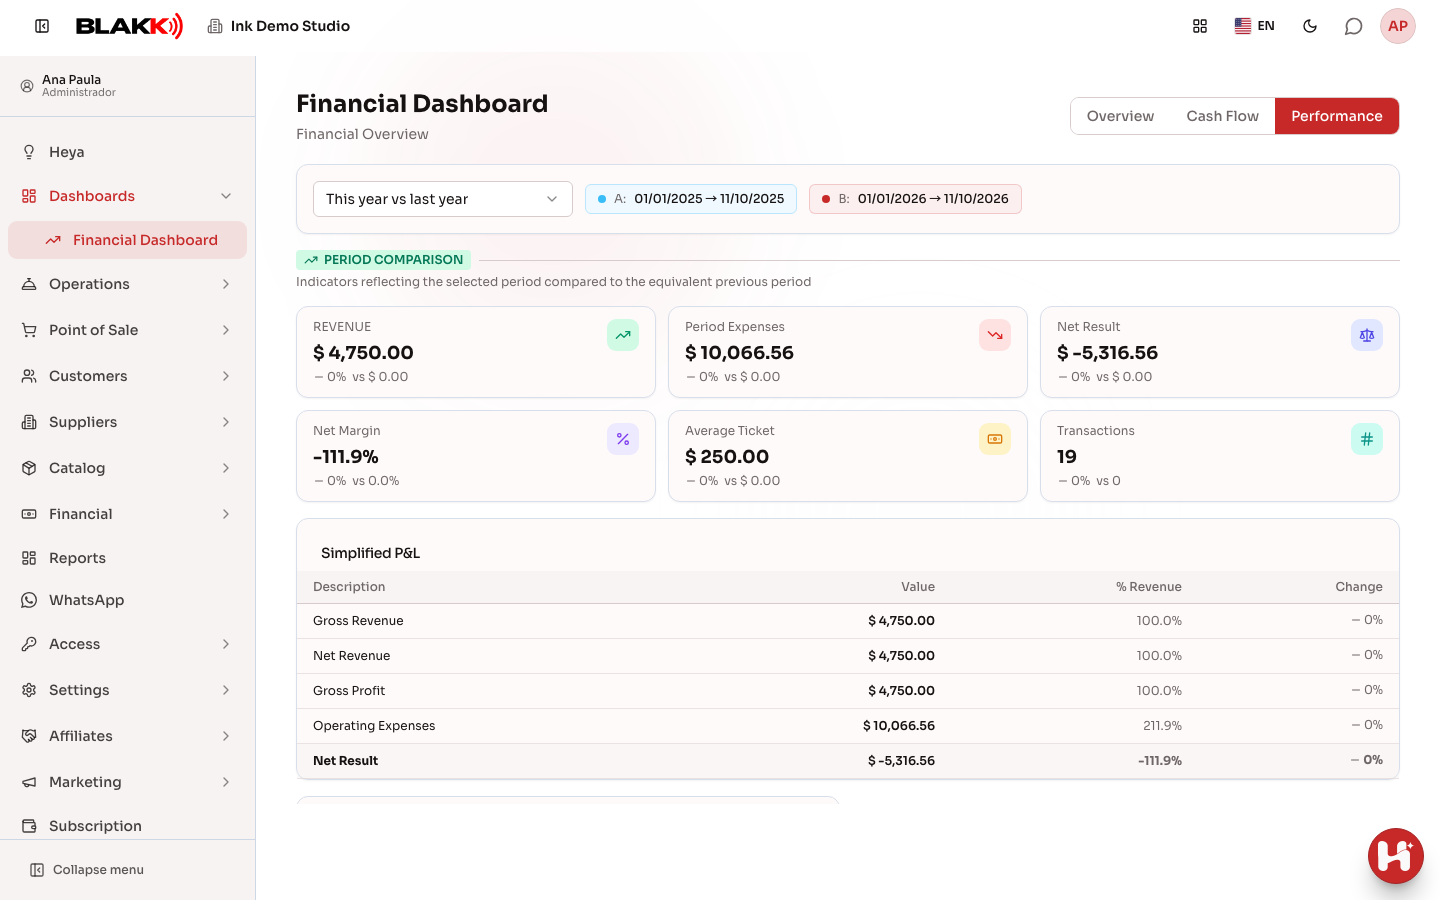
Section titled “Step 4 — Compare periods on the Performance tab”Click the Performance tab to compare two periods side by side — this month versus last month, this year versus last year, or a custom date range. The Simplified P&L table summarizes the results for the compared periods.
Step 5 — Check which days cash is at risk
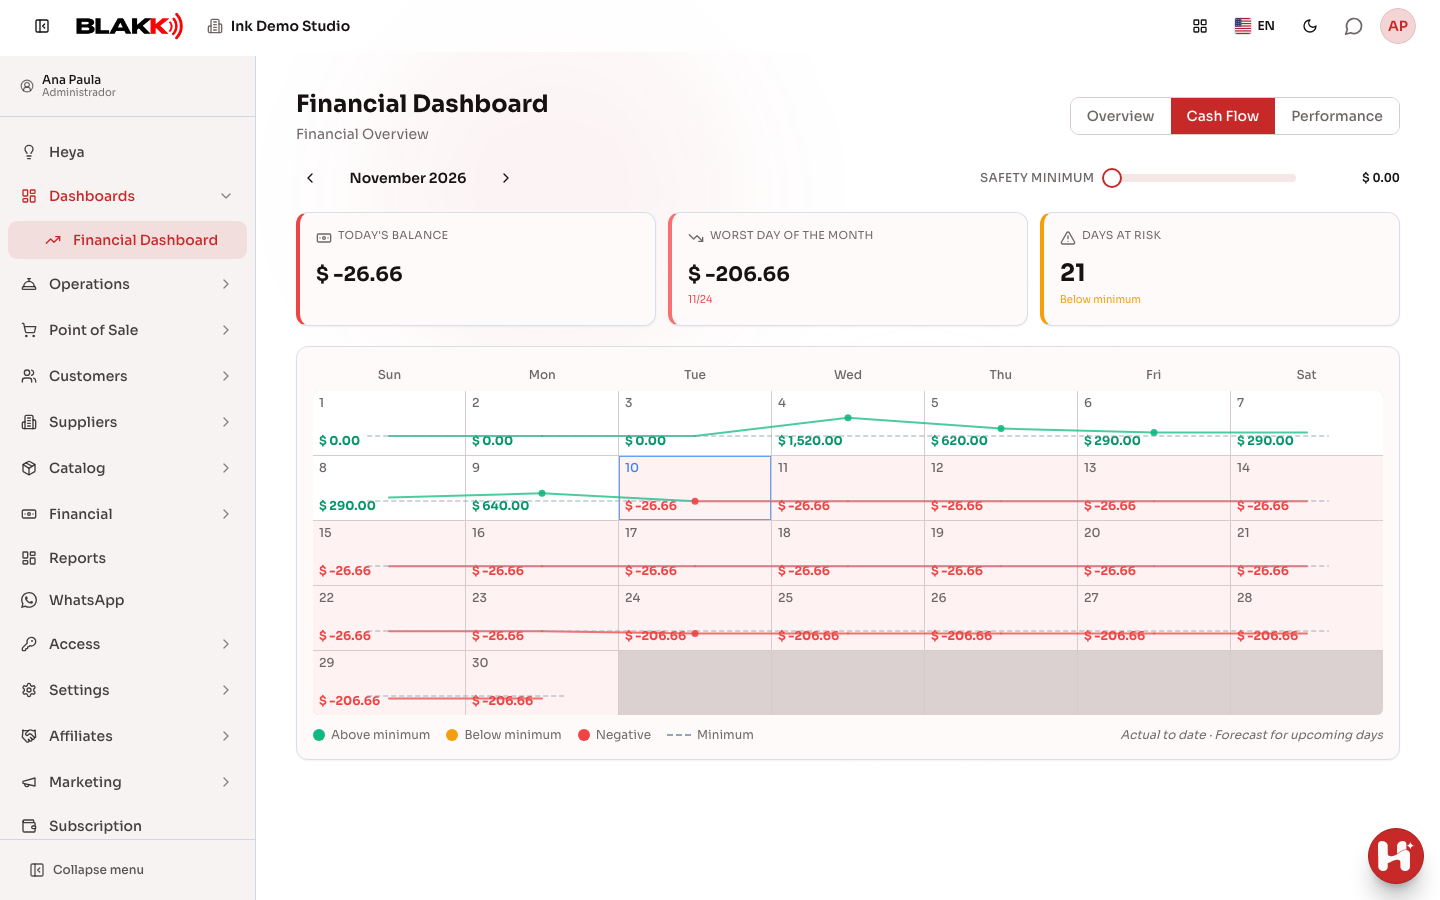
Section titled “Step 5 — Check which days cash is at risk”On the Cash Flow tab, a monthly calendar shows the projected balance day by day, with colors based on the Safety Minimum you set using the slider. Days below that amount are highlighted so you can act before you run short on cash.
What happens next
Section titled “What happens next”- This is an almost entirely read-only dashboard — the only setting you can change here is the Safety Minimum on the Cash Flow tab. It applies to the entire business (not just you) and changes the color of every day on the calendar as soon as you save it.
- The Receivables card at the top adds up everything currently outstanding, regardless of the selected period. The Accounts Receivable table below it, on the other hand, follows the selected period. The two amounts may not match, and that’s expected.
- The Unpaid card, by contrast, follows the selected period, just like the Accounts Payable table below it.
- Revenue includes all sales for the period: tickets, Point of Sale sales, and work orders, if your studio uses them. The same revenue amount appears in the cards, chart, and Performance tab. A customer payment (paying off a debt or credit) doesn’t count as a new sale, and a sale created when a work order is completed isn’t counted twice.
- Revenue is counted by the sale date; expenses are counted by the installment’s due date — which isn’t necessarily the date the money actually went out or came in. For the closest view of actual cash flow, use the Cash Flow tab.
Common mistakes and questions
Section titled “Common mistakes and questions”Q: What’s the difference between this Dashboard, the Financial Hub, and the Financial tab in the regular Dashboard? A: The Financial Hub is for taking action right away (recording a payment or receipt); the Financial tab in the Dashboard gives you a quick snapshot of the week without interrupting your daily routine; the Financial Dashboard helps you analyze your financial health over time — compare periods, understand where expenses come from, and spot days when cash is at risk before they happen.
Q: Why doesn’t the “Receivables” card change when I switch periods? A: Because it adds up everything currently outstanding, regardless of the selected period. Only the Accounts Receivable table below it follows the period filter.
Q: Does “Period expenses” show what actually went out of my cash balance? A: Not exactly — expenses are counted by the installment’s due date, not the date it was actually paid. To see what really affected your cash balance, use the Cash Flow tab.
Q: Which sales count toward the dashboard’s revenue? A: All sales for the period, from any channel (tickets and Point of Sale), plus work orders if your studio uses them. Customer payments that only pay off an old debt aren’t included because the amount was already counted as a sale on the date it was made.
Q: What is the “Safety Minimum” on the Cash Flow tab? A: It’s the amount below which you consider your cash balance to be at risk. You can adjust it using the slider on that tab. It’s a single setting for the entire business (not per bank account or user), and it immediately applies to the whole calendar and the Days at Risk card.
Q: Does the Performance tab use the same period I selected in Overview? A: No — the Performance tab has its own comparison periods (this year versus last year, this week versus last week, and so on), independent of the Overview filter.
Q: Do the Accounts Receivable and Accounts Payable tables show everything that’s outstanding? A: Not necessarily — each table has a limit on the number of rows shown. If there are many open items in a period, the list may be incomplete, and no warning will appear on the screen.
Q: Can I record a payment or enter an expense here? A: No — this dashboard is read-only, except for the Safety Minimum setting. To take action, use the Financial Hub or the Expenses article.
Related
Section titled “Related”- Financial Hub: track and record payments and receipts
- Expenses: enter, split into installments, attach a document, and pay
- Dashboard: your studio’s daily overview, all in one place
- Chart of Accounts: organize your business’s accounts
- Cost Center: organize expenses by business area
- Home page: your daily overview when you log in