Dashboard: your studio’s daily overview, all in one place
What it is
Section titled “What it is”The Dashboard is the screen that gives you an overview of your entire studio in one place: how much money came in, how many appointments took place, what today’s schedule looks like, and how much each tattoo artist sold and is owed in commission. It doesn’t replace any other screen—it’s your starting point for deciding where to go next.
When to use it
Section titled “When to use it”- When you open the system in the morning, to check today’s schedule and see if any customers are waiting to confirm.
- At the end of the month, to compare revenue with the previous month before deciding whether to step up your marketing or run a promotion.
- When checking a tattoo artist’s commission, before opening the Commission Report to finalize payment.
Before you start
Section titled “Before you start”The Dashboard is part of the Appointments module. If you don’t see this option in the Operations menu, ask the studio owner to enable the module for your business type.
To see the Financial tab, the Finance module must also be enabled.
If the modules are enabled but you still can’t see the Dashboard, ask the owner of the studio to grant you access in Access → Roles.
Step by step
Section titled “Step by step”Step 1 — View your daily overview
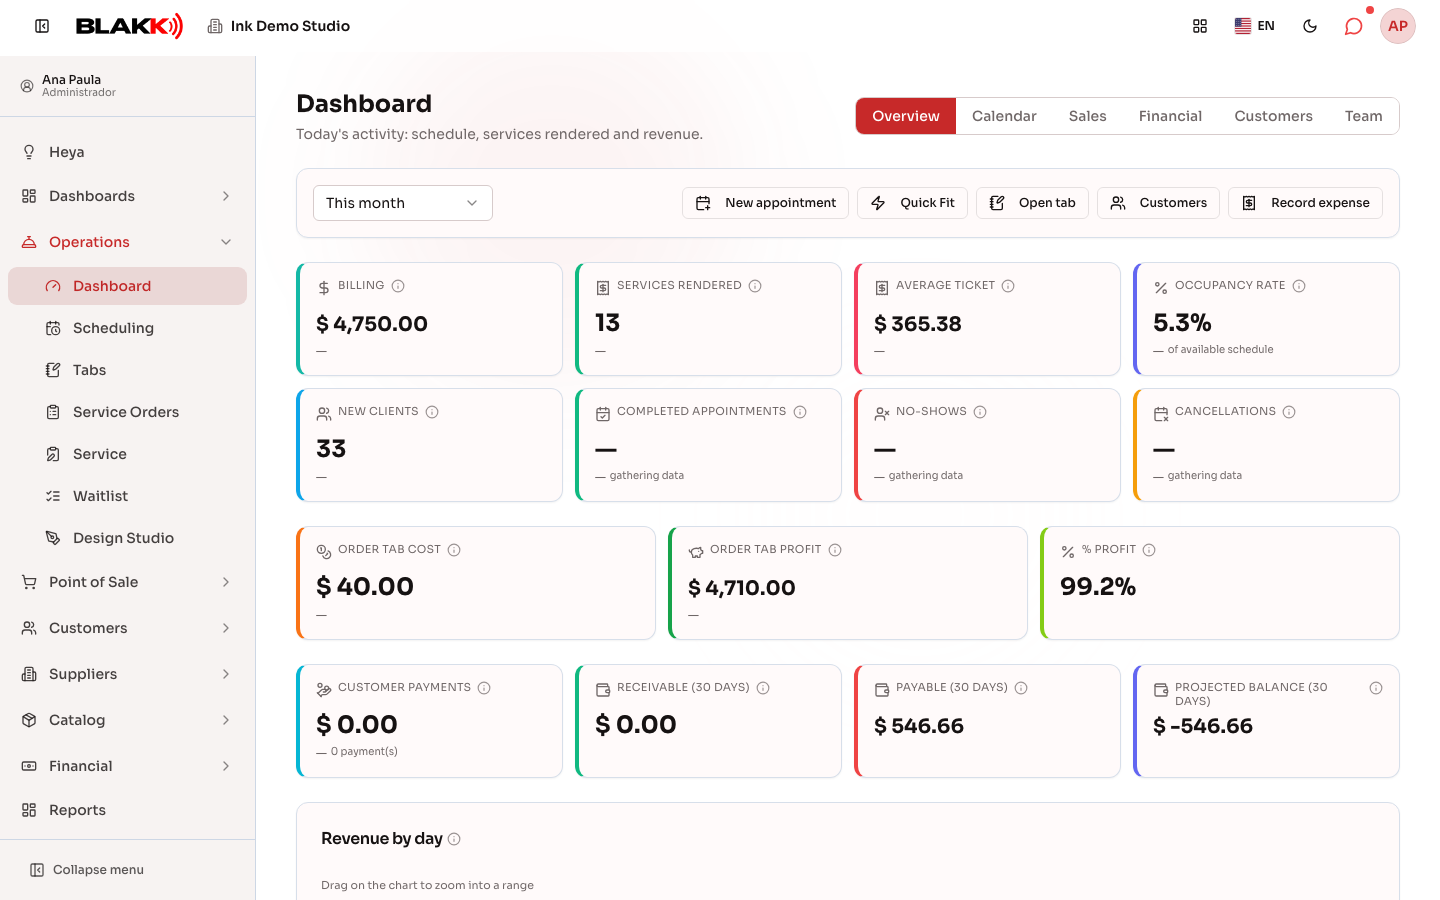
Section titled “Step 1 — View your daily overview”Open Dashboard from the Operations menu. The Overview tab is selected by default. Choose a date range from the selector at the top (the default is this month) to see revenue, appointments, average ticket, occupancy rate, new customers, completed appointments, no-shows, and cancellations—each card shows the change compared with the equivalent previous period.
Below that, three cards show the results for order tabs paid during the period: Order Tab Cost (the cost of products sold and materials and supplies used), Order Tab Profit (the order tab total excluding taxes and discounts, minus the cost and the payment processing fee paid by the studio), and % Profit (profit divided by that amount). These use the same calculations as the Cost, Profit, and % Profit columns in the Order Tab Report, where you can review each order tab individually. These three cards only appear for users who have access to the Order Tab Report in Access → Roles.
The next row includes the Customer Payments card, which shows payments received through the customer payment screen during the period: customer credit or deposits, and payments toward outstanding balances, along with the number of payments received. This money isn’t included in revenue, which only counts sales: credit becomes revenue when the order tab using it is paid. If the Finance module is enabled, this row also shows amounts receivable and payable over the next 30 days. The Revenue breakdown card appears further down.
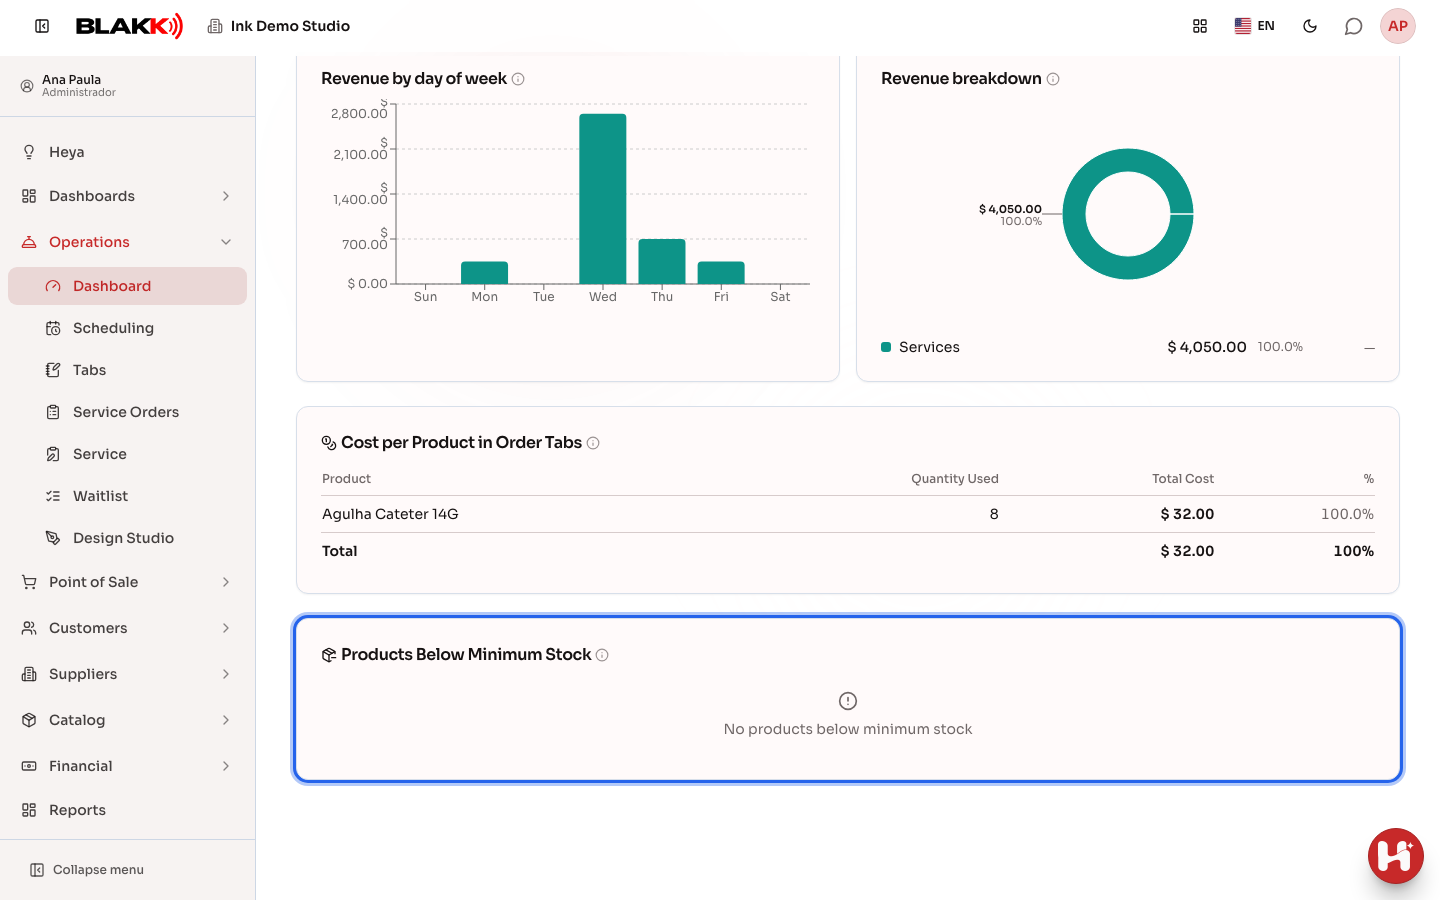
When the selected period spans more than one day (such as this month), the Revenue by day chart also appears, showing the total sold each day through today. Drag across the chart to zoom in on a range of days and see the total and daily average for that period.
The Quick actions button next to the date range opens shortcuts for New appointment, Quick Fit, Open tab, Customers, and Record expense without leaving the Dashboard. On your phone, all the shortcuts are grouped under this button: tap it to see the options, then tap the one you want.
At the bottom of the Overview tab, the Products Below Minimum Stock card lists products whose available stock has reached or fallen below the minimum stock level, along with each product’s available quantity and minimum level. Products furthest below the minimum appear first, and the number next to the title shows how many there are. Unlike the other cards, it shows the stock right now: changing the date range at the top doesn’t change the list. Only products with a minimum stock level set are included (see Minimum stock).
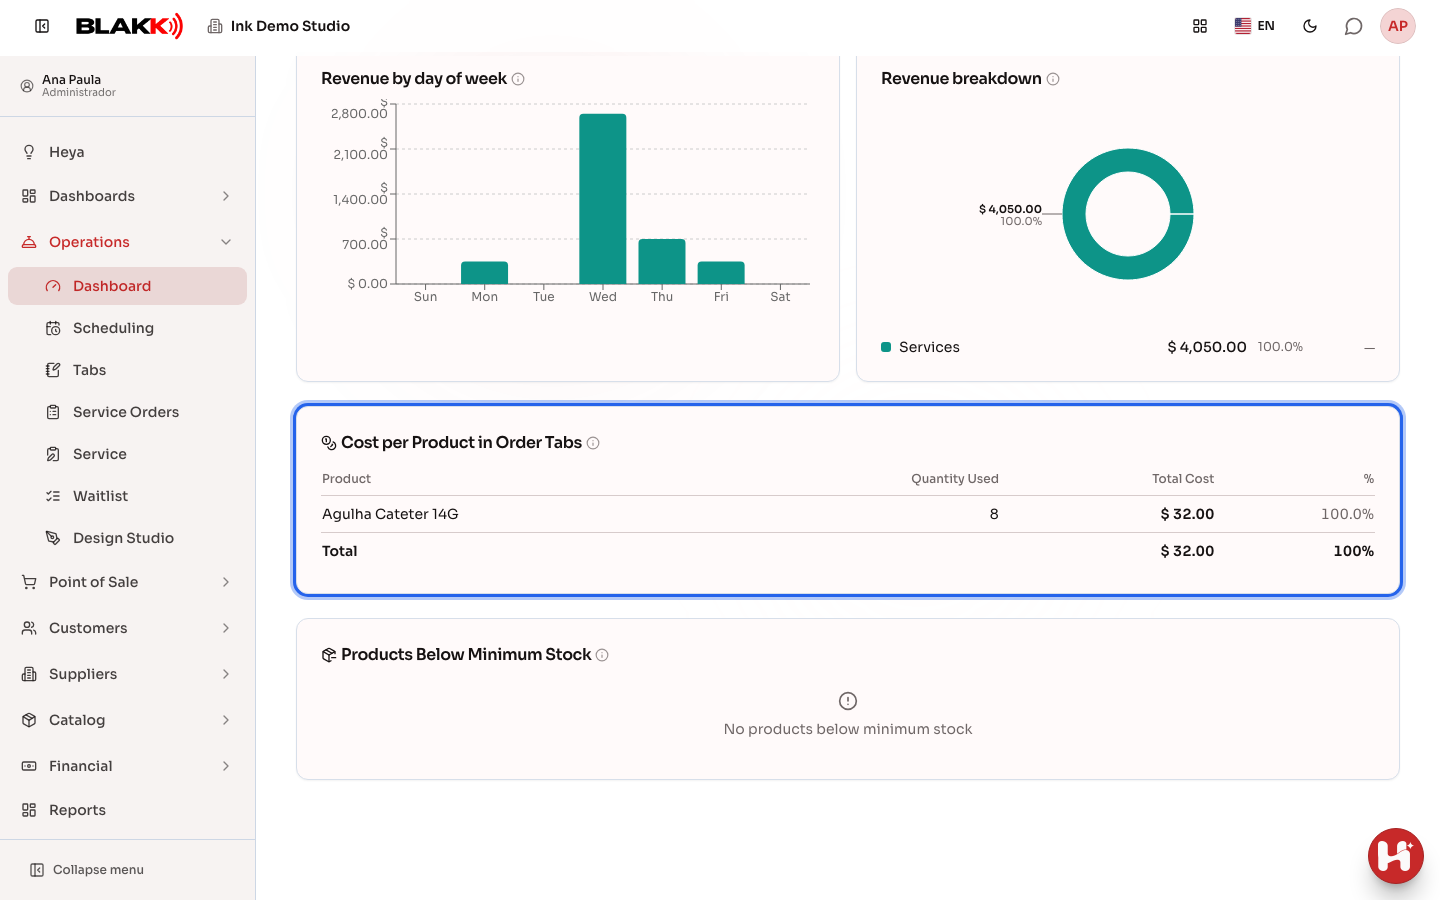
Just above it, the Cost per Product in Order Tabs section lists each material, supply, or product used in order tabs paid during the period, from highest cost to lowest: Quantity Used (using the unit from the product record), Total Cost, and its percentage of the total cost. The last row shows the total cost of all items. This section only appears for users who have access to the Order Tab Report in Access → Roles, just like the cost and profit cards.
Step 2 — Check today’s schedule
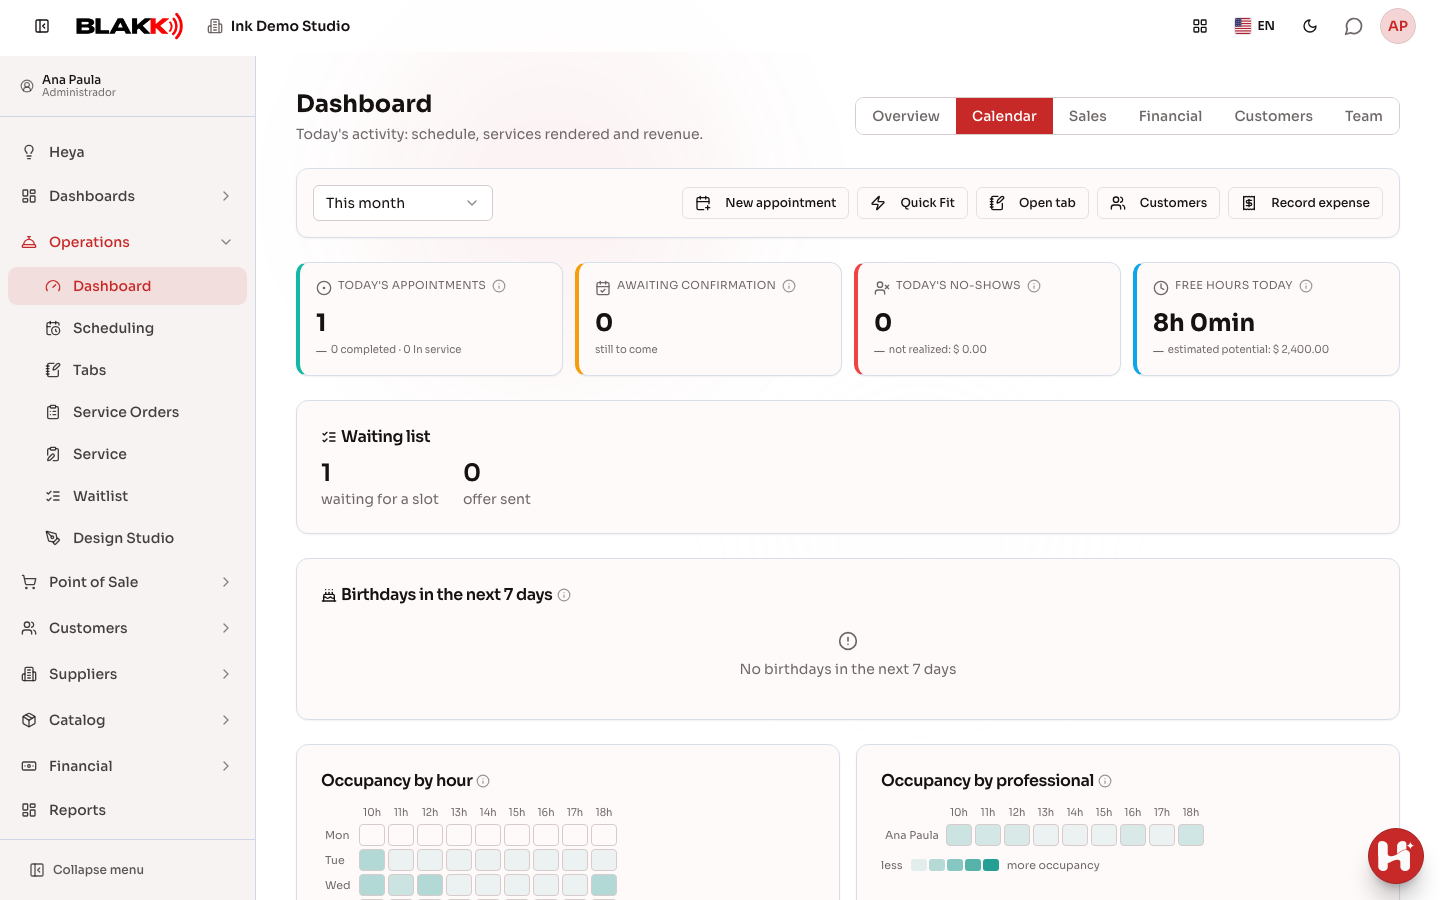
Section titled “Step 2 — Check today’s schedule”Click the Calendar tab to see today’s activity—appointments, how many are still waiting for customer confirmation, today’s no-shows, and available hours on the schedule. Below that, you’ll find the Waiting list (how many customers are waiting for an opening and how many have received an offer), Birthdays in the next 7 days, and the heat maps for Occupancy by hour and Occupancy by professional (and by station, if your studio uses stations).
Step 3 — Review sales performance
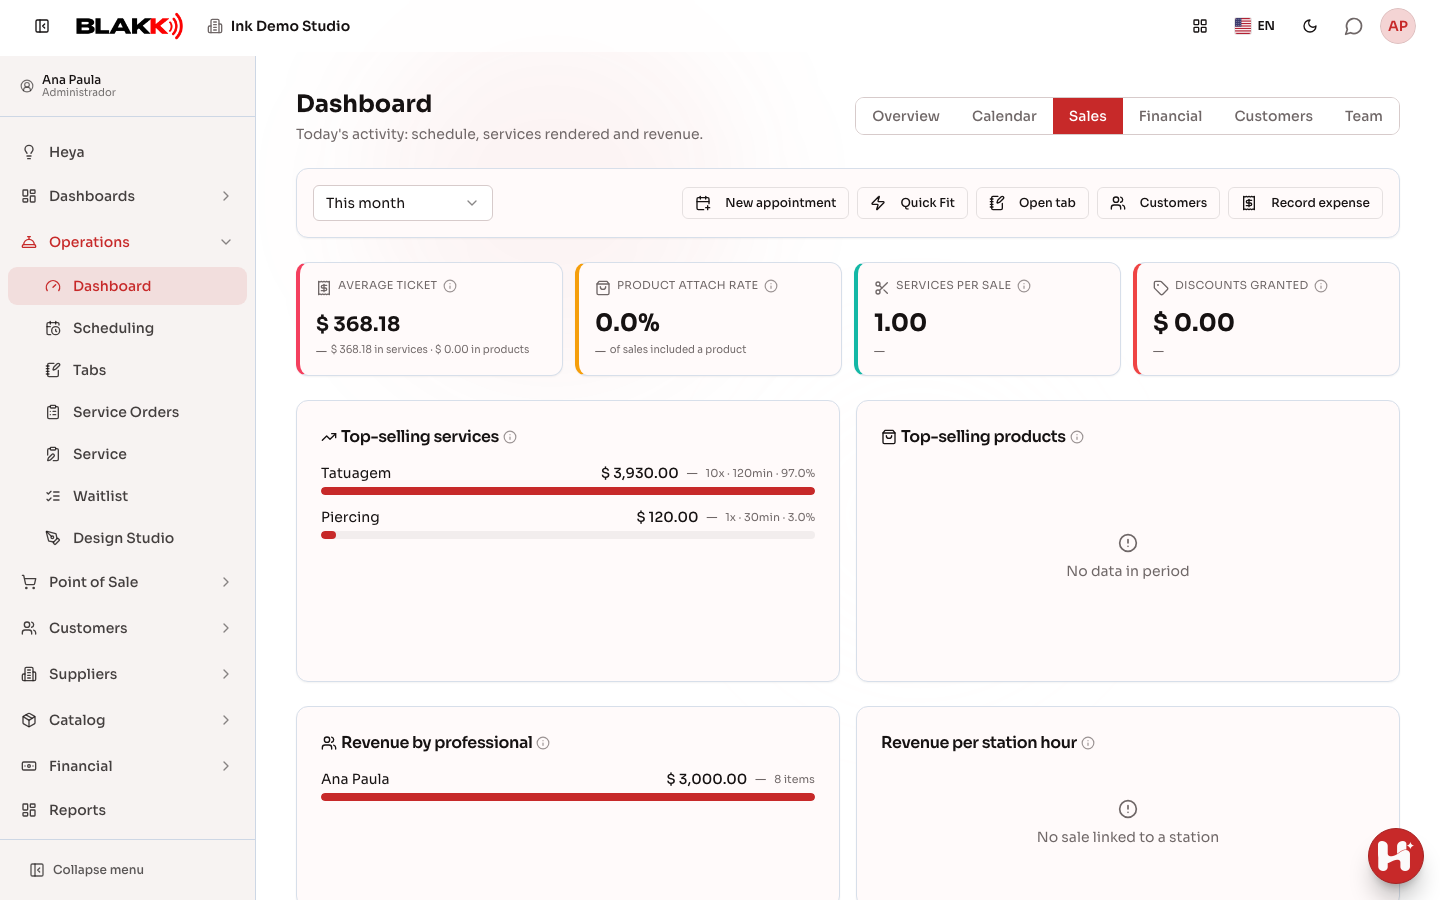
Section titled “Step 3 — Review sales performance”On the Sales tab, see the average ticket (including the service and product portions), Product attach rate (the percentage of sales that included at least one retail product), how many services are included in each sale, and the discounts given. Below that are the Top-selling services and Top-selling products rankings, along with Revenue by professional.
Step 4 — Review your finances
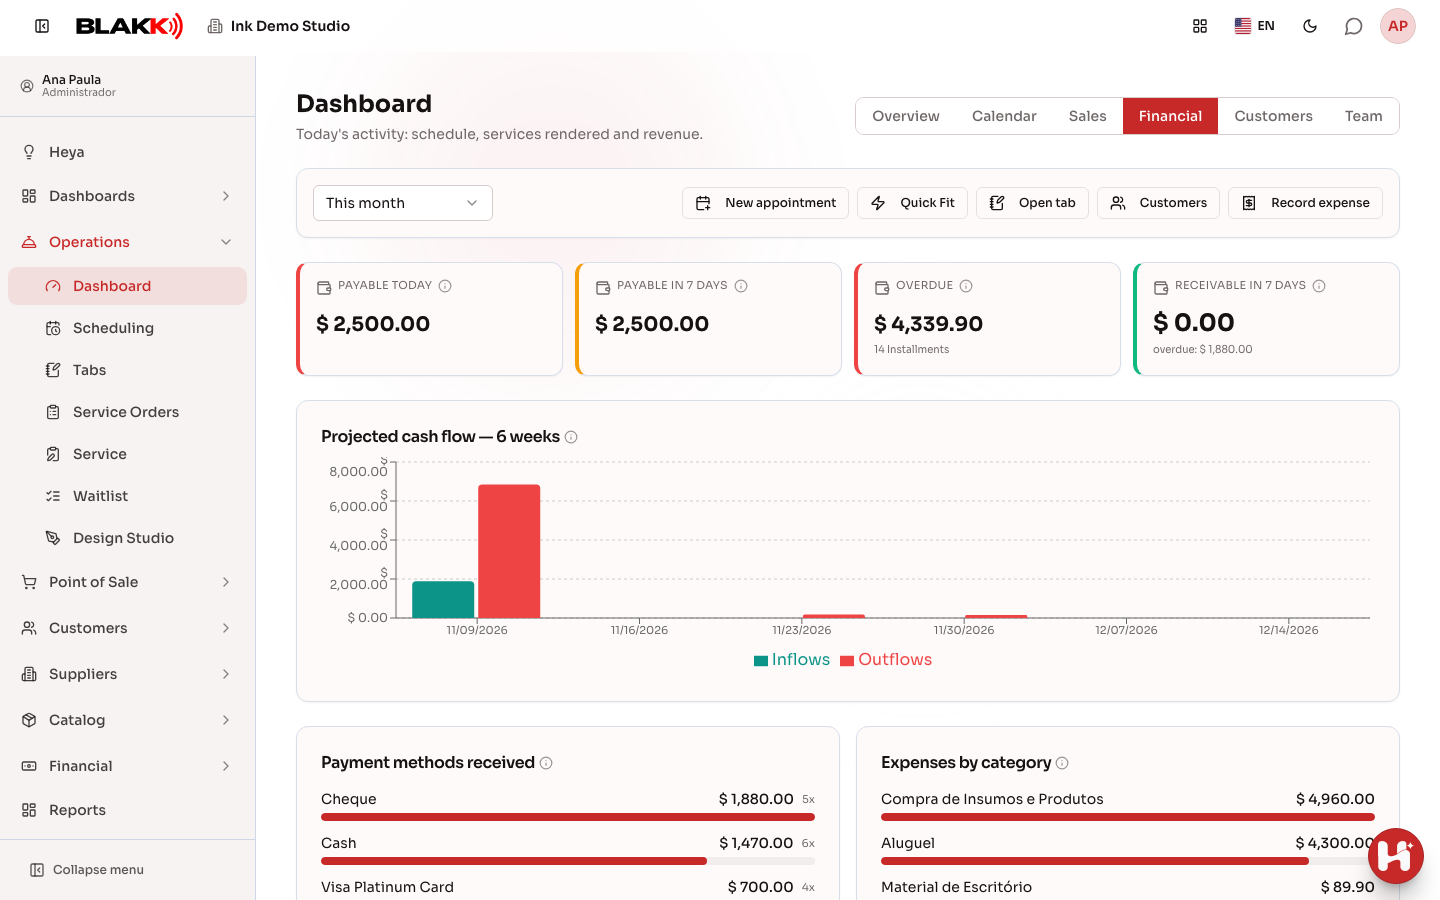
Section titled “Step 4 — Review your finances”On the Financial tab, see what’s Payable today, Payable in 7 days, which bills are Overdue, and what’s Receivable in 7 days, along with the cash flow forecast for the next 6 weeks, Payment methods received, and Expenses by category for the selected period.
Step 5 — Review your customer base
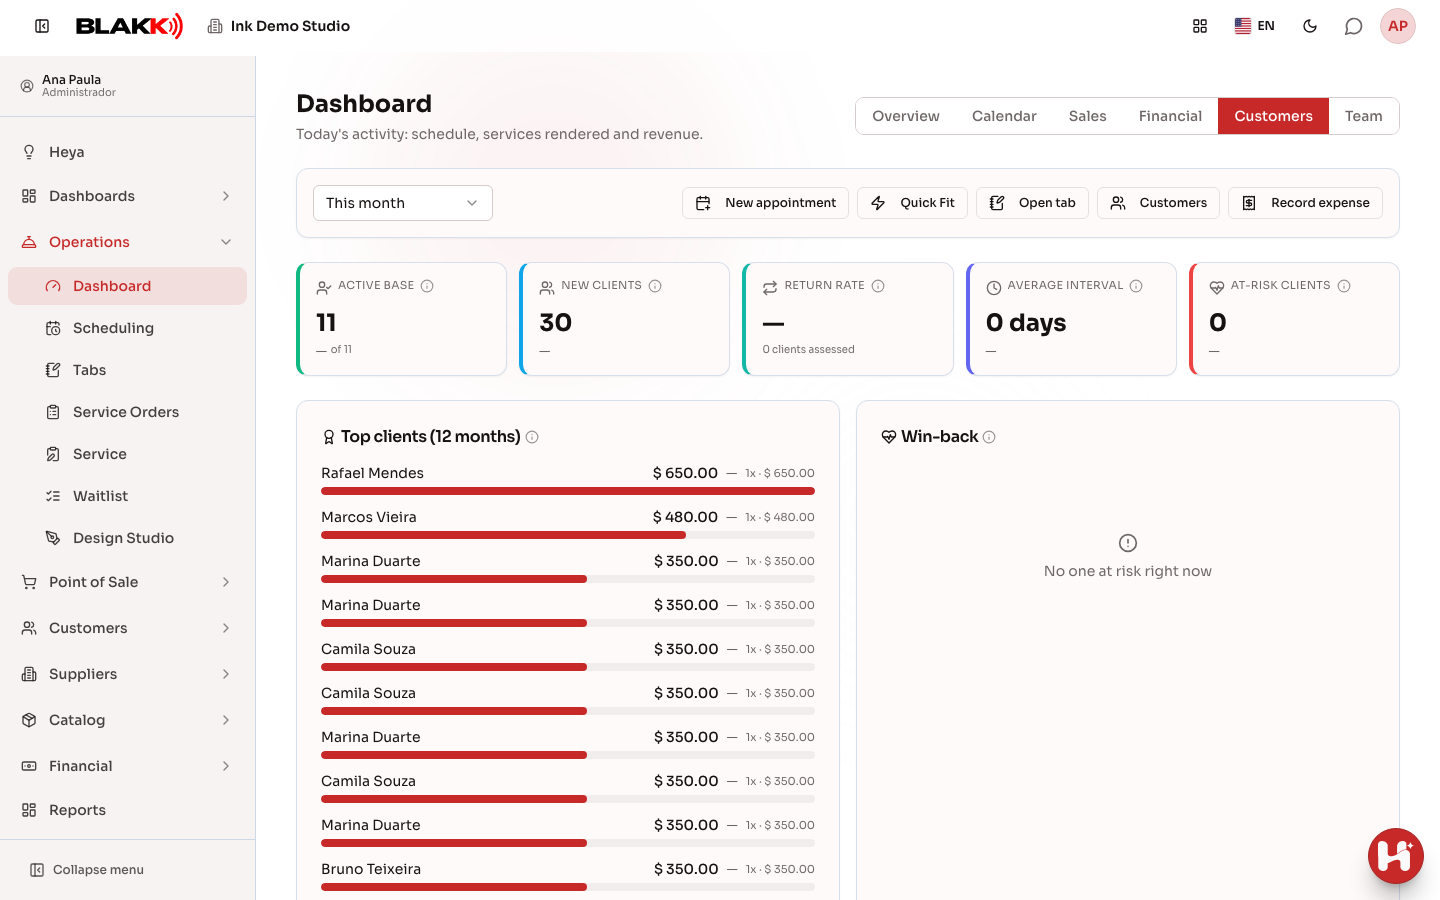
Section titled “Step 5 — Review your customer base”On the Customers tab, see how many customers are active, how many are new, your return rate, and the average time between visits. Below that are Top clients (12 months) and Win-back, which shows customers at risk of not returning, based on each customer’s average time between visits.
Step 6 — Review team output
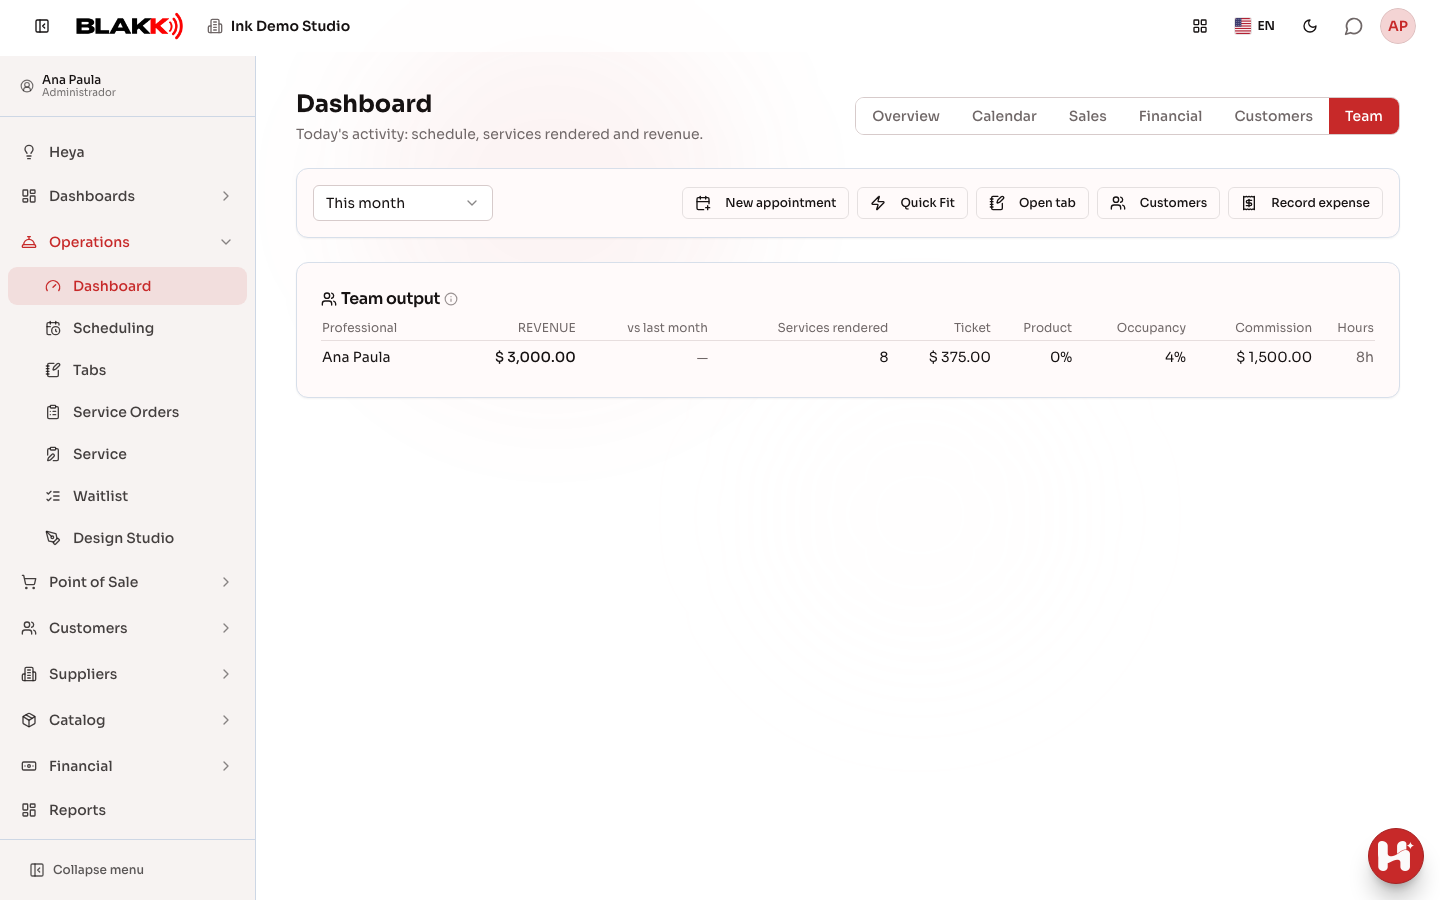
Section titled “Step 6 — Review team output”On the Team tab, the Team output table shows each tattoo artist’s revenue (and how it compares with last month), appointments, average ticket, product sales, occupancy rate, commission calculated for the period—the same amount shown in the Commission Report—and hours.
What happens next
Section titled “What happens next”- This is a read-only dashboard. To take action (record a payment, open an order tab, confirm an appointment), go to the corresponding screen. You can’t make changes from the Dashboard.
- The numbers on the Overview, Sales, Finance, and Team tabs are totals for the selected period in the date range selector at the top. The Customers tab shows a snapshot of the current moment—changing the date range won’t change those numbers.
- The list of products below minimum stock on the Overview tab is also a snapshot of the current moment. It shows the company’s current stock, regardless of the selected date range.
- The “today” cards on the Calendar tab (today’s appointments, today’s no-shows, and available hours) always compare with yesterday, regardless of the date range selected at the top.
- Percentage changes (the arrow next to each card) only appear when there are at least 10 records in both periods being compared. Very short periods or newly created studios won’t show the arrow.
- The Completed, No-shows, and Cancellations cards show a dash (—) instead of 0% until an appointment has left the initial “Scheduled” status for the first time.
- Commission on the Team tab uses the same calculation as the Commission Report, so the amount won’t differ between screens when you close out the month.
Common mistakes and questions
Section titled “Common mistakes and questions”Q: A customer left a deposit (or credit), but revenue didn’t change. Is that right? A: Yes. Credit, deposits, and payments toward outstanding balances received through the customer payment screen appear on the Customer Payments card, not in revenue. When the order tab using that credit is paid, its amount is included in that day’s revenue. This prevents the same money from being counted twice.
Q: I refunded an order tab. Does it disappear from revenue? A: The refund records a negative amount on the day it was issued. If the sale and refund fall within the same period, revenue for that order tab is zero. It still counts as an appointment because the service was performed; only the money was returned.
Q: Why doesn’t the daily revenue chart appear? A: It only appears when the selected period is longer than one day. If you choose Today or another one-day period, there’s nothing to compare day by day. The chart goes through today; future days in the selected period aren’t shown.
Q: Why do some cards show a dash (—) instead of 0%? A: There isn’t enough history to measure that yet—for example, no appointment has left its initial status. Showing 0% would incorrectly suggest that a result has already been measured.
Q: Why doesn’t the comparison with the previous period appear on some cards? A: The system hides the change when the current or previous period has fewer than 10 records. This avoids showing something like “+900%” when the comparison is based on too few records.
Q: Do the numbers on the Customers tab change if I choose a different date range at the top? A: No. Unlike the other tabs, the customer metrics are a snapshot of the current moment (for example, how many customers are active right now), not a total for the selected period.
Q: I can’t see the Finance tab on the Dashboard. What should I do? A: The Finance module probably isn’t enabled for your business type. Ask the studio owner to enable it.
Q: Does the Calendar tab show activity for the date range selected at the top? A: Only partially. Cards that refer to “today” always compare with yesterday because “today” doesn’t change with the selected date range.
Q: Why can’t I see the Open Register card on the Finance tab? A: It only appears when a register is currently open and you have access to the Close Register screen. Without both, the card won’t appear, even if the Finance module is enabled.
Q: Is the commission on the Team tab the final amount I’ll pay the professional? A: It uses the same calculation as the Commission Report, so it’s a reliable reference. However, check the report before finalizing payment, since entries made after you opened the Dashboard won’t appear until the screen refreshes.
Q: The Order Tab Profit is the same as revenue. Was the cost left out? A: Cost is based on the cost price of products. If materials and supplies used for services don’t have a cost price in their records, the cost will be zero. Check the cost price for each supply and the services’ Materials and Supplies tab. This card also only includes order tabs paid during the period. A sale made directly through the Point of Sale, without an order tab, is included in Revenue but not in these three cards.
Q: Why can’t I see the profit cards or the Cost per Product in Order Tabs section? A: They only appear for users who have access to the Order Tab Report. Ask the studio owner to grant you access to the report in your profile under Access → Roles.
Q: A product has low stock, but it doesn’t appear on the Dashboard list. Why? A: The list only shows active products with Minimum Stock greater than zero at the company selected at the top. Check the minimum stock level on the product record’s Stock tab. Services aren’t included because they don’t have stock.
Related
Section titled “Related”- Appointments: how to schedule, track, and complete an appointment
- Order tabs: open one, add items, assign a professional, and close it
- Sales Report: track everything that was sold
- Finance Hub: track and record payments and receipts
- Customers: add customers, apply tags, and view their history
- User Time Clock Report: track your team’s clock-in and clock-out times
- Order Tab Report: track open and paid order tabs
- Commission Report: calculate and pay what each professional is owed
- Financial Dashboard: understand your studio’s financial health over time
- Home Page: your daily overview when you log in
- Minimum stock: get notified when a product is running low